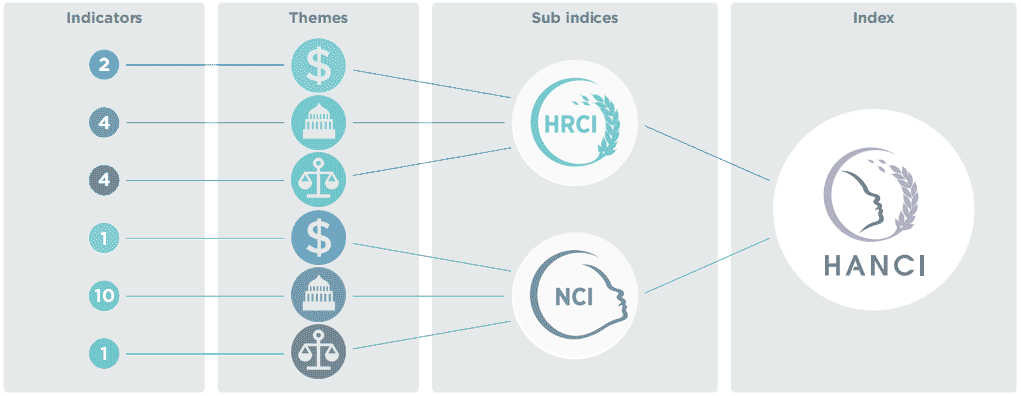
HANCI-Africa compares and ranks the performance of 45 African countries based on 22 indicators of political commitment. The indicators are split between indicators of commitment to hunger reduction (10 indicators) and indicators relating to commitment to addressing undernutrition (12 indicators). By separately analysing nutrition commitment and hunger reduction commitment we identify how governments prioritise action on hunger and/or undernutrition. We also show how diverse political commitment levels relate to levels of hunger and undernutrition. In both sets they are grouped under three themes:
- Laws (Legal frameworks – for example the level of constitutional protection of the right to food)
- Policies (government programmes and policies – for example the extent to which nutrition features in national development policies/strategies)
- Spending (public expenditures – for example the percentage of government budgets spent on agriculture)
This diagram shows the structure of the Index. Click on the themes to view the indicators
Hunger Reduction Commitment Indicators - Public Spending
- 2005-2014Government expenditures on agriculture as share of total government expenditures (Percentage).
Color codes or labels used in score cards:
Green if >=10
Yellow if <10 and >=7.5
Red if <7.5Source:IFPRI (SPEED database), ReSAKSS calculations using IMF Government Statistics
- 2014Government expenditure on health as a share of total government expenditure (Percentage).
Color codes or labels used in score cards:
Green if >=15
Yellow if <15 and >=11.25
Red if <11.25Source:WHO Global Health Observatory Data Repository
Hunger Reduction Commitment Indicators - Policies
- 2005-2014Assesses the existence of an institutional, legal and market framework for secure land tenure and the procedure for land acquisition and accessibility to all.
The Ratings Scale goes from 6 (high) through 1 (low), as follows:
6 - Good for an 3 years
5 - Good
4 - Moderately Satisfactory
3 - Moderately Unsatisfactory
2 - Unsatisfactory
1 - Unsatisfactory for 3 years
Color code/labels used in scorecards
Very strong/Strong if >=4
Moderate if >2.99 AND <4
Weak/Very weak if <=2.99Source:The International Fund for Agricultural Development (IFAD) - 2001-2014Percentage of children under five years of age who were registered at the moment of the survey.
Color code/labels used in scorecards
Green if >=90
Yellow if between 70 AND 90
Red if <=70Source:UNICEF: DHS/MICS
- 2004-2013This indicator assesses to what extent the agricultural research and extension system is accessible to poor farmers, including women farmers, and is responsive to the needs and priorities of the poor farmers. Coding is done in the same manner as for the 'security of access to land' indicator.
Color code/labels used in scorecards
Very strong/Strong if >=4
Moderate if >2.99 AND <4
Weak/Very weak if <=2.99Source:The International Fund for Agricultural Development (IFAD)
- 2008-201610 = Social safety nets are comprehensive.
7 = Social safety nets are well developed, but do not cover all risks for all strata of the population.
4 = Social safety nets are rudimentary and cover only few risks for a limited number of beneficiaries.
1 = Social safety nets do not exist.
Color code/labels used in scorecards
Very strong/Strong if >=7
Moderate if >4 AND <7
Weak/Very weak if <=4Source:Transformation Index of the Bertelsmann Stiftung (BTI)
Hunger Reduction Commitment Indicators - Laws
- 2006-2016Strong = 3 "Explicit for all citizens and/or specific groups or incorporated under article protecting living standards AND/OR Ratified international law is automatically assigned equal status as constitutional law"
Moderate = 2 "Implicit as part of a broader right in constitutional law."
Weak = 1 "No constitutional protection, OR as Directive Principle (not justiceable) OR Likely or confirmed equality of ratified international law to national legislation"Source:FAO information paper and FAO web database on Right to Food. - 2011The extent to which women have equal economic rights in law and in practice.
0: there were no economic rights for women in law and systematic discrimination based on sex may have been built into law.
1: women had some economic rights under law, but these rights were not effectively enforced.
2: women had some economic rights under law, and the government effectively enforced these rights in practice while still allowing a low level of discrimination against women in economic matters.
3: all or nearly all of women’s economic rights were guaranteed by law and the government fully and vigorously enforces these laws in practice.
Color code/labels used in scorecards
In Law & Practice if 3
In Law, not in Practice if 1 OR 2
Not in Law if 0Source:The Cingranelli-Richards (CIRI) Human Rights Data Project
- 2011-2014Score based on women’s legal rights and de facto rights to own and/or access agricultural land. Value based on the following scale:
1: equal
0.5: Women have equal legal rights but there are discriminatory practices against women’s access to and ownership of land in practice.
0: Women have no/few legal rights to access or own land or access is severely restricted by discriminatory practices. (note: in HANCI calculation, this scoring is reversed for consistency)
Color code/labels used in scorecards
In Law & Practice if 1
In Law, not in Practice if 0.5
Not in Law if 0Source:Social Institutions and Gender Index (SIGI) accessed via OECD's Gender, Institutions and Development Database (GID-DB)
- 2006-2016The Constitution clearly references a right to social security (see Annex II of the source document).
Green if "yes"
Red if "no"Source:FAO information paper
Nutrition Commitment Indicators - Public Spending
- 2011-20150 = no budgets or where no confirming information could be found
0.5 = sectoral budgets for nutrition
1 = separate budget line for nutrition
Color codes or labels used in score cards:
Yes if 1
Sectoral only if 0.5
No if 0Source:SUN Compendium of fiches; IDS Nutrition Governance; Save the Children Nutrition Barometer; WHO Landscape Analysis; Global Nutrition Report (N4G tracking tables).
Nutrition Commitment Indicators - Policies
- 1996-2014The percentage of children aged 6-59 months who received 2 high doses of vitamin A supplements within the last year.
Color code/labels used in scorecards
Green if >=90
Yellow if >70 AND <90
Red if <=70Source:MICS Indicators, UNICEF field offices and WHO, Countdown 2015 reports, author calculations based on government data - 2010-2014Whether governments promote complementary feeding practices of children aged 6–9 months and continued breastfeeding of children at ages 12–15 and 20–23 months.
Green if "yes"
Red if "no"Source:Sun Reports; world breast feeding trends initiative - 2014-2015The percentage of population with access to an improved drinking-water source.
Color code/labels used in scorecards
Green if >=90
Yellow if >70 AND <90
Red if <=70Source:Joint Monitoring Programme (JMP) for water supply and Sanitation - WHO/UNICEF - 2014-2015The percentage of population with access to improved sanitation facilities.
Color code/labels used in scorecards
Green if >=90
Yellow if >70 AND <90
Red if <=70Source:Joint Monitoring Programme (JMP) for water supply and Sanitation - WHO/UNICEF - 2016Source: Web-based searches. The total count of key search terms in a selected policy document divided by the number of pages in the document, expressed as country ranking relative to other countries. Search terms: nutritio*.*; undernutrition/under-nutrition; malnutrition/mal-nutrition nutrient; diet*.*; stunt*.*; wasting/wasted; short-for-age; short for age; height-for-age; height for age; weight-for-age; weight for age; weight for height; weight-for-height; Underweight; under-weight; Low birth weight; Thinness; Micro-nutrient; micronutrient; 1000 days; one thousand days; Breastfeed*.*; Behavior change; behaviour change; Iron deficiency anaemi/anemi; Zinc; Deworm; de-worm; Vitamin A; Supplementary feed; complementary feed.
Scorecards present the ranks of these scores
Strong if rank <=15
Moderate if rank 16 to 30
Weak if rank >=31Source:web-based searches.
- 2011-2015Whether a national nutrition policy, plan or strategy exists.
Green if "yes"
Red if "no"Source:EIU Global Food Security Index
- 2005-2015Percentage of women aged 15–49 years attended at least once during pregnancy by skilled health personnel (doctor, nurse or midwife).
Color code/labels used in scorecards
Green if >=90
Yellow if >70 AND <90
Red if <=70Source:UNICEF: DHS/MICS
- 2000-2015Whether a multisectoral and multistakeholder coordination mechanism exists.
Green if "yes"
Red if "no"Source:SUN fiches/Country docs and unpublished SUN country documents
- 2010-2015Whether governments identify time bound nutrition targets in public policy documents.
Green if "yes"
Red if "no"Source:SUN Movement Annual Progress Reports; Global Nutrition Report 2015
- 2005-2016Has there been a Demographic and Health Survey / Multiple Indicator Cluster Survey /comparable national nutrition survey in the past three years?
1: Yes, if the survey was dated 2013 or thereafter, or currently underway.
0: No, new surveys were not undertaken after 2013.Source:UNICEF, DHS and national nutrition surveys
Nutrition Commitment Indicators - Laws
- 2016The extent to which the International Code for Marketing of Breastmilk Substitutes is enshrined in law.
4 = ICBMS is fully in law.
3 = Many provisions of ICBMS are in law.
2 = Few provisions are in law.
1 = No legal measures.
Color code/labels used in scorecards
Fully Enshrined if 4
Few/Many Aspects Enshrined if 2 or 3
Not Enshrined in Law if 1Source:"Marketing of Breast-milk Substitutes: National Implementation of the International Code, Status Report 2016."
We include indicators that allow the index to assess ‘curative’ action (efforts that seek to address immediate needs) as well as ‘preventive’ action (efforts to avert hunger and undernutrition, to reduce food insecurity and to prevent people from becoming malnourished). Consequently, some of our proxy indicators measure interventions that are not primarily instituted to combat hunger or undernutrition (e.g. civil registration of births or investments in public health). Nevertheless, governments recognise that these efforts do contribute to hunger reduction and improved nutrition statuses in the short, medium and long term, and are therefore included in the index.


